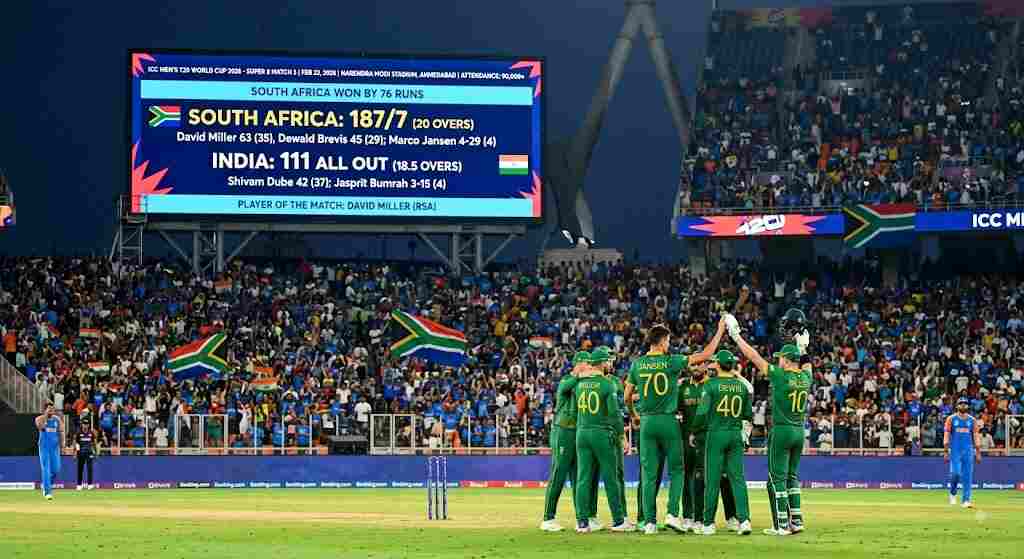
The India national cricket team vs south africa national cricket team match scorecard from February 22, 2026, tells a story of South African dominance at the Narendra Modi Stadium in Ahmedabad. In front of over 90,000 passionate fans, the Proteas handed India a crushing 76-run defeat in the ICC Men’s T20 World Cup 2026 Super 8 opener.
South Africa posted a formidable 187/7 from their 20 overs, riding on brilliant half-centuries from David Miller and Dewald Brevis, before their bowlers skittled India for just 111 in 18.5 overs.The victory snapped India’s remarkable 18-match winning streak in T20 internationals and sent a clear message to the tournament favorites.
While Jasprit Bumrah produced a masterclass with the ball (3/15), India’s batting lineup crumbled under sustained pressure from Marco Jansen and Keshav Maharaj. This comprehensive South African win in the Super 8 stage has major implications for both sides’ World Cup campaigns.
Match Overview Table
| Information | Match Details |
| Event | ICC Men’s T20 World Cup 2026 |
| Game | South Africa vs. India (Super 8, Match 3) |
| Date | Sunday, February 22, 2026 |
| Venue | Narendra Modi Stadium, Ahmedabad, India |
| Attendance | 90,000+ |
| Winner | South Africa |
| Final Score | India lost by 76 runs to South Africa 187/7 (20 overs) 111 all out (18.5 overs). |
| Broadcast | Star Sports, Hotstar (India); SuperSport (South Africa); Willow TV (USA) |
Core Match Statistics Overview
Team Stats Table:
| Metric | South Africa | India |
| Total Runs | 187/7 (20.0 overs) | 111 all out (18.5 overs) |
| Run Rate | 9.35 | 5.89 |
| Fours | 13 | 5 |
| Sixes | 11 | 6 |
| Extras | 11 (b1, lb2, wd6, nb2) | 5 (lb1, wd4) |
| Wickets Lost | 7 | 10 |
| Powerplay Score | 67/0 (6 overs) | 31/2 (6 overs) |
Metric Subheadings:
Batting Firepower in the Middle Overs
- South Africa scored 117 runs between overs 4.1 and 15.4, losing only two wickets, with Brevis (45) and Miller (63) anchoring the innings.
- India managed just 55 runs in the same phase while losing five wickets, completely losing momentum after the powerplay.
Bowling Economy and Wicket-Taking
- Jasprit Bumrah’s 4-over spell yielded just 15 runs and 3 wickets at an economy of 3.75 — the most economical bowling performance of the match.
- India’s other bowlers, however, went at 11.75 (Chakravarthy), 11.25 (Pandya), and 16.00 (Dube) runs per over, bleeding crucial runs.
Powerplay Contrast
- South Africa raced to 67/0 after the first six overs, setting a platform for a massive total.
- India stumbled to 31/2, losing Ishan Kishan for a golden duck and Tilak Varma cheaply, never recovering from the early setbacks.
Period-by-Period Analysis
South Africa Innings — Over-by-Over Breakdown:
| Period | Overs | Runs Scored | Wickets Lost | Run Rate |
| Powerplay | 0.1 – 6.0 | 67 | 0 | 11.17 |
| Middle Phase | 6.1 – 15.0 | 85 | 3 | 9.44 |
| Death Overs | 15.1 – 20.0 | 35 | 4 | 7.29 |
South Africa’s openers de Kock (6) and Markram (4) fell early, but Rickelton (7) kept the scoreboard ticking before Brevis and Miller joined forces for a 97-run partnership that transformed the innings.
- Miller’s 63 off 35 balls, featuring 7 fours and 3 sixes, provided the perfect late-innings acceleration, while Stubbs’ unbeaten 44 off 24 ensured South Africa finished with a commanding total.
- India pulled things back slightly in the death overs, with Bumrah removing Corbin Bosch and Arshdeep dismissing Jansen, but the damage had already been done.
India Innings — Over-by-Over Breakdown:
| Period | Overs | Runs Scored | Wickets Lost | Run Rate |
| Powerplay | 0.1 – 6.0 | 31 | 2 | 5.17 |
| Middle Phase | 6.1 – 15.0 | 55 | 5 | 6.25 |
| Death Overs | 15.1 – 18.5 | 25 | 3 | 6.82 |
Ishan Kishan’s golden duck and Tilak Varma’s dismissal for 1 put India on the back foot immediately. Abhishek Sharma’s 15 was the only bright spot in the powerplay.
- Shivam Dube fought a lone battle with 42 off 37, but he received no support from the other end as wickets tumbled regularly.
- The Indian innings folded with 7 balls to spare when Marco Jansen cleaned up the tail, completing a comprehensive South African victory.
Detailed Team Player Statistics
South Africa Player Statistics
| Player | Runs | Balls | 4s | 6s | SR | Bowling (O-M-R-W) |
| David Miller | 63 | 35 | 7 | 3 | 180.00 | – |
| Dewald Brevis | 45 | 29 | 3 | 3 | 155.17 | – |
| Tristan Stubbs | 44* | 24 | 1 | 3 | 183.33 | – |
| Marco Jansen | 2 | 6 | 0 | 0 | 33.33 | 4-0-29-4 |
| Aiden Markram | 4 | 7 | 0 | 0 | 57.14 | – |
South Africa Impact Summary:
David Miller’s Player of the Match performance was the backbone of South Africa’s innings. His 63 off 35 at a strike rate of 180 came at the perfect moment, accelerating after Brevis had laid the foundation.
Dewald Brevis continued his aggressive form with 45 off 29, while Tristan Stubbs’ unbeaten 44 off 24 provided the finishing kick. Marco Jansen was outstanding with the ball, taking four wickets, including the vital ones of Shivam Dube and Abhishek Sharma.
India Player Statistics
| Player | Runs | Balls | 4s | 6s | SR | Bowling (O-M-R-W) |
| Shivam Dube | 42 | 37 | 1 | 3 | 113.51 | 2-0-32-1 |
| Suryakumar Yadav | 18 | 22 | 2 | 0 | 81.82 | – |
| Hardik Pandya | 18 | 17 | 0 | 1 | 105.88 | 4-0-45-0 |
| Abhishek Sharma | 15 | 12 | 2 | 1 | 125.00 | – |
| Jasprit Bumrah | 0 | 1 | 0 | 0 | 0.00 | 4-0-15-3 |
India Impact Summary:
Shivam Dube was the lone bright spot with the bat, scoring 42 off 37, but his slow strike rate of 113.51 reflected India’s struggles to rotate strike. Captain Suryakumar Yadav managed just 18 off 22, continuing his poor run of form. Jasprit Bumrah was sensational with the ball, taking 3/15 from his 4 overs, but received minimal support from the other end.
Statistical Leaders Summary Table
| Category | South Africa | India |
| Leading Scorer | David Miller (63) | Shivam Dube (42) |
| Second Leading Scorer | Dewald Brevis (45) | Suryakumar Yadav (18) |
| Top Wicket-Taker | Marco Jansen (4) | Jasprit Bumrah (3) |
| Best Bowling Economy | Aiden Markram (1.8) | Jasprit Bumrah (3.75) |
| Most Sixes | David Miller (3) | Shivam Dube (3) |
Analytical Dissection (“Why They Won / Why They Lost”)
Why South Africa Won
The Miller-Brevis Partnership
The 97-run partnership between Dewald Brevis and David Miller was the game-defining moment. Coming together at 20/3 in the 4th over, they rebuilt the innings and then accelerated aggressively. Brevis’ 45 off 29 provided the stability, while Miller’s 63 off 35 provided the fireworks. Their partnership came at a run rate of 9.7, completely shifting the momentum.
Marco Jansen’s Lethal New-Ball Spell
| Bowler | Overs | Wickets | Runs | Economy |
| Marco Jansen | 4 | 4 | 29 | 7.25 |
| Keshav Maharaj | 4 | 3 | 25 | 6.25 |
| Corbin Bosch | 3 | 2 | 18 | 6.00 |
Jansen removed Abhishek Sharma and Tilak Varma inside the powerplay, then returned to dismiss Dube and Bumrah. Keshav Maharaj choked the middle overs, picking up three wickets, including the dangerous Rinku Singh for a duck.
Clinical Powerplay Execution
South Africa’s powerplay score of 67/0 gave them the platform to post a total above 180. India managed just 31/2 in the same phase — a difference of 36 runs that proved insurmountable.
Why India Lost
Top-Order Collapse
| India Top 4 | Runs | Balls |
| Ishan Kishan | 0 | 4 |
| Abhishek Sharma | 15 | 12 |
| Tilak Varma | 1 | 2 |
| Suryakumar Yadav | 18 | 22 |
| Total | 34 | 40 |
India’s top four contributed just 34 runs from 40 balls. Two ducks (Kishan, Bumrah) and three single-digit scores left the chase dead in the water.
Over-Reliance on Shivam Dube
Dube scored 42 of India’s 111 runs — 37.8% of the total. No other batter crossed 20. This dependence on one player exposed India’s batting fragility when the top order failed.
Expensive Bowling in the Middle Overs
| India Bowler | Overs | Runs | Wickets | Economy |
| Varun Chakravarthy | 4 | 47 | 1 | 11.75 |
| Hardik Pandya | 4 | 45 | 0 | 11.25 |
| Shivam Dube | 2 | 32 | 1 | 16.00 |
While Bumrah was exceptional (3/15), the other bowlers were expensive. Chakravarthy and Pandya conceded over 11 runs per over, allowing South Africa to accelerate in the middle and death overs.
Historical Context & Advanced Insights
Season Series Breakdown:
| Match | Date | Winner | Margin |
| 1st T20I | Feb 2026 | South Africa | 49 runs |
| 2nd T20I | Feb 2026 | India | 6 wickets |
| 3rd T20I | Feb 2026 | India | 30 runs |
| 4th T20I | Feb 2026 | India | 9 wickets (ODI) |
| Super 8 | Feb 22, 2026 | South Africa | 76 runs |
Advanced Statistical Insights:
The assist-to-field-goal ratio — or in cricketing terms, the partnership-to-total ratio — tells the story. South Africa’s 97-run partnership between Brevis and Miller accounted for 51.9% of their total. India’s highest partnership was just 28 runs between Dube and Pandya, reflecting their inability to build any substantial stands.
The balls-per-six metric is equally revealing: South Africa hit a six every 10.9 balls, while India managed one every 18.8 balls. This difference in power-hitting efficiency completely changed the complexion of the match.
Efficiency per possession (or per over): South Africa scored 9.35 runs per over, compared to India’s 5.89. That 3.46-run-per-over gap over 20 overs represents a difference of nearly 70 runs — precisely the margin of victory.
Game Implications & Key Lessons
What This Means for South Africa:
- The Proteas have proven they can beat the tournament favorites on Indian soil, giving them immense psychological advantage heading into the knockout stages.
- David Miller’s return to form is a massive boost — his 63 off 35 showed he can anchor and accelerate when needed.
- Marco Jansen’s 4-wicket haul gives South Africa a genuine new-ball threat that can dismantle any top order.
What This Means for India:
- The 18-match winning streak is over — India must regroup quickly and address their top-order fragility.
- Suryakumar Yadav’s continued poor form (18 off 22) is becoming a serious concern — his T20 average in 2025 was just 14.20.
- India’s over-reliance on Bumrah with the ball — he took 3/15 but others conceded heavily — needs immediate attention.
Key Lessons:
- Powerplay dominance wins games — South Africa’s 67/0 vs India’s 31/2 was the match’s defining statistical gap.
- One bowler cannot win a match — Bumrah’s 3/15 was neutralized by expensive spells from others.
- Partnerships matter more than individual brilliance — South Africa’s 97-run stand vs India’s highest partnership of 28.
- Finishing ability separates good from great — Miller (63 off 35) and Stubbs (44* off 24) showed how to close an innings.
- Early wickets in a chase are fatal — losing Kishan for a duck and Varma for 1 left India chasing the game from the first over.
- Six-hitting efficiency is a differentiator — South Africa hit 11 sixes compared to India’s 6.
FAQ & Conclusion
Frequently Asked Questions
Who won the India vs South Africa Super 8 match in the T20 World Cup 2026?
South Africa won by 76 runs at the Narendra Modi Stadium in Ahmedabad on February 22, 2026.
What was the final score of the india national cricket team vs south africa national cricket team match?
South Africa scored 187/7 in 20 overs, and India were bowled out for 111 in 18.5 overs.
Who scored the most runs for South Africa?
David Miller top-scored with 63 runs off 35 balls, hitting 7 fours and 3 sixes.
Who was the Player of the Match?
David Miller was named Player of the Match for his match-winning 63 off 35 deliveries.
What were Jasprit Bumrah’s bowling figures?
Bumrah took 3 wickets for 15 runs in his 4 overs, with an economy rate of 3.75.
How many wickets did Marco Jansen take?
Marco Jansen took 4 wickets for 29 runs in his 4 overs.
What was India’s highest individual score?
Shivam Dube scored 42 runs off 37 balls, the only Indian batter to cross 20.
Where was the match played?
The Narendra Modi Stadium in Ahmedabad, India, hosted the game.
Conclusion
The India national cricket team vs south africa national cricket team match scorecard from February 22, 2026, serves as a stark reminder that efficiency and teamwork consistently outperform individual brilliance in T20 cricket.
South Africa’s clinical execution — from Miller and Brevis’ match-defining partnership to Jansen’s devastating new-ball spell — was a masterclass in tournament cricket. India, despite Bumrah’s heroics with the ball, were undone by a brittle top order and an over-reliance on one bowler. As the Super 8 stage heats up, both teams will take valuable lessons from this encounter: the Proteas will draw confidence from their comprehensive victory, while India must address their batting fragility if they are to bounce back and challenge for the World Cup crown.